


WaterWatch and EstuaryWatch
The WaterWatch and EstuaryWatch portal supports two significant citizen science programs that monitor the health of Victorian waterways and estuaries. The portal provides essential resources for all members to access current information and data, as well as providing the public full access to data and knowledge generated by the programs.
2025 Data Portal Update
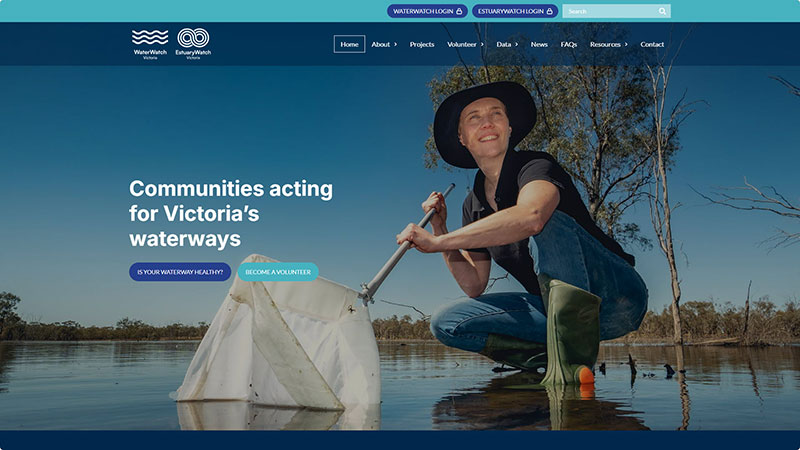
In February 2025 a new and improved WaterWatch and EstuaryWatch website and data portal was launched.
One of the biggest changes with the new portal was that it brought together the previously separate WaterWatch and EstuaryWatch websites, combining them into one single easy-to-use platform. While cosmetic improvements were a welcome part of the upgrades, the overarching goal was all about making citizen science more effective and impactful.
Volunteers collecting data in the field have a more accessible and interactive platform, while researchers and decision-makers also benefit from clearer insights and easier access to long-term monitoring trends.
 |
Background
Both WaterWatch and EstuaryWatch are well-established, important community engagement programs promoting interest in water issues including sustainability, water management and the health of local waterways and connecting local Victorian communities.
WaterWatch facilitates citizen science and community involvement in river health and sustainable water practices. WaterWatch community members are encouraged to become participants in their local environment through waterway monitoring and ongoing activities.
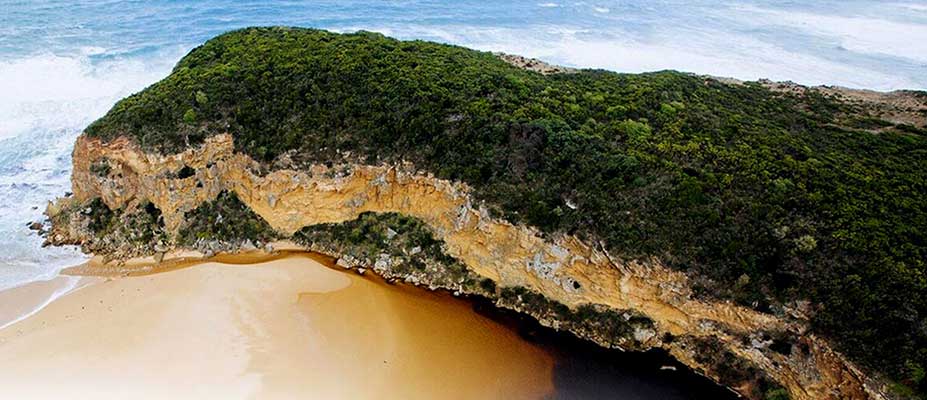
Both programs rely heavily on community and volunteer contributions to assist with regional data collection and recordings of water quality across Victoria's rivers and associated waterways. EstuaryWatch promotes the monitoring of estuary health at 22 active Victorian estuaries and is supported through involvement of local catchment management authorities.
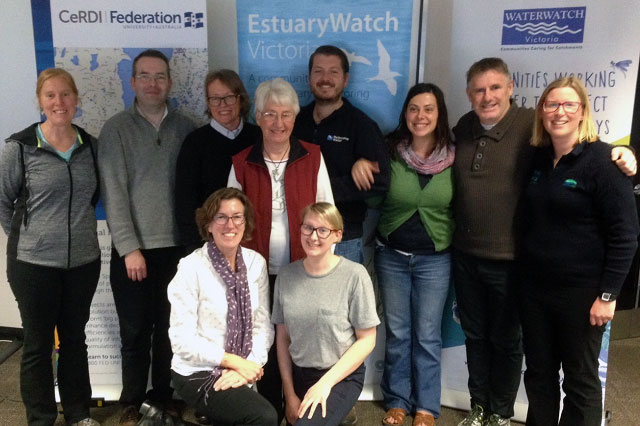 |
| EstuaryWatch and WaterWatch prototype launch September 2016 Back row: Birgita Hansen - CeRDI, Paul Feely- CeRDI, Deirdre Murphy- Corangamite CMA, Ros Gibson- EstuaryWatch volunteer, Richard Akers- Melbourne Water, Cass Davis- North Central CMA, Nigel Philpot- Manningham City Council, Rose Herben- Corangamite CMA Front: Kirsten Hogan- North Central CMA, Tess Hayes- EstuaryWatch Volunteer |
Outcomes
The Waterwatch and EstuaryWatch sites have been developed to provide easier access to data and information through innovative technical tools and data portals:
Since the original redevelopment in 2016, and the subsequent evolutions;
- Data contributors have access to an intelligent interface to regularly submit data with less risk of error;
- The data approval process for region coordinators is streamlined via “at a glance” statistical review tools and online datasheet submission.
- The volume of citizen science data collected has continued to grow.
- Data from both programs is readily available for research, education and decision making by the public, educators, catchment management groups, local, and state government.
Innovations
Innovations for the WaterWatch and EstuaryWatch portals are possible due to the rich history of data.
- Find My Waterway
Waterways have a range of unique naming conventions, and parts of rivers may carry multiple names, both official and local. There can also be separate waterways with the same name in different parts of the state. The "Find My Waterway" tool allows a user to find active monitoring locations using their location, postcode, suburb, town or river name, reducing difficulty, reducing confusion, and providing nearby relevant results. An integrated and interactive map also allows further exploration and geographic understanding.
- Instant Data Visualisation
Monitoring sites have "at a glance" trend charts for all monitored physical chemical observations; providing instant snapshot of trends in water quality without needing to export or further analysis the data. Advanced charts and full data exports are also available for the expert user.
- Traffic Light System for Water Quality - In WaterWatch areas with consistent data, a colour-coded system provides a quick visual representation of overall water quality over time, helping to identify changes or concerns at a glance. The traffic light ratings combine observed citizen science data with the EPA Victoria Environmental Reference Standard Indicators for surface water geographic regions across Victoria.
- Estuary Salt Water Wedge Charts
Estuary snapshots generate a “salt wedge” chart displaying the salinity at different depths along the length of the estuary; visualising where the layers of hyper saline, salt water, brackish water and fresh water are at a point in time.
- Estuary Photo Points
Regular photos at fixed points generate a panorama like history of the state of the estuary, including whether the estuary is closed or open, and any weather events.
-

RESEARCH OUTPUT
Patrick Bonney (PhD 2021) - Citizen science: Knowledge, networks and the boundaries of participation

Hansen, B., Dahlhaus, P., Macleod, A., Herben, R., Murphy, D., Feely, P., & Murphy, A. (2016). Waterwatch and EstuaryWatch portals: a collaborative research partnership to develop online tools to enhance citizen science, data collection and provision, and information sharing. Spoken paper. Australian Society for Limnology Conference 2016, Ballarat.
-

NEWS
EstuaryWatch wins 2018 Victorian Coastal Award - 29 May 2018
EstuaryWatch Victoria recently received a 2018 Victorian Coastal Award.... Continue reading...
Profiling activities for Waterwatch and EstuaryWatch - 4 December 2017
Corangamite Catchment Management Authority (CCMA) submitted an application to the River Basin Management Society (RBMS) 2017 awards for two citizen science programs, Waterwatch and EstuaryWatch. CeRDI... Continue reading...
Launch of Waterwatch and EstuaryWatch Websites - 18 October 2016
Waterwatch and EstuaryWatch are now live. CeRDI has played an important role in developing these sites in collaboration with project partners.... Continue reading...
-

PARTNERS
Corangamite Catchment Management Authority
Corangamite Catchment Management Authority is a key partner on these projects, providing funding and resourcing for the programs and the redevelopment. Corangamite CMA employs the two program coordinators, who provide support to both programs across the rest of the state.
North Central Catchment Management Authority
North Central Catchment Management Authority is an active partner on these projects through the regional WaterWatch coordinator.
Melbourne Water
Melbourne Water contributes to both programs through the regional coordinators.

East Gippsland Catchment Management Authority
East Gippsland Catchment Management Authority contributes to both programs through the regional coordinators.

Goulburn-Broken Catchment Management Authority
Goulburn-Broken Catchment Management Authority contributes to both programs through the regional WaterWatch coordinator.

Mallee Catchment Management Authority
Mallee Catchment Management Authority contributes to both programs through the regional WaterWatch coordinator.
North East Catchment Management Authority
North East Catchment Management Authority contributes to both programs through the regional WaterWatch coordinator.
West Gippsland Catchment Management Authority
West Gippsland Catchment Management Authority contributes to both programs through the regional coordinators.
Wimmera Catchment Management Authority
Wimmera Catchment Management Authority contributes to both programs through the regional WaterWatch coordinator.
Glenelg-Hopkins Catchment Management Authority
Glenelg-Hopkins Catchment Management Authority contributes to both programs through the regional coordinators.